Monitoring
Introduction
Section titled “Introduction”As a cluster administrator, it may benefit you to have monitoring capabilities over both the state and execution of cluster-applied Kyverno policies. This includes monitoring over any applied changes to policies, any activity associated with incoming requests, and any results produced as an outcome. If enabled, monitoring will allow you to visualize and alert on applied policies, and is critical to overall cluster observability and compliance.
In addition, you can specify the scope of your monitoring targets to either the rule, policy, or cluster level, which enables you to extract more granular insights from collected metrics.
Installation and Setup
Section titled “Installation and Setup”When you install Kyverno via Helm, additional services are created inside the kyverno Namespace which expose metrics on port 8000.
$ values.yaml
admissionController:  metricsService:    create: true  # ...
backgroundController:  metricsService:    create: true  # ...
cleanupController:  metricsService:    create: true  # ...
reportsController:  metricsService:    create: true  # ...
By default, the service type is going to be ClusterIP meaning that metrics can only be scraped by a Prometheus server sitting inside the cluster.
In some cases, the Prometheus server may sit outside your workload cluster as a shared service. In these scenarios, you will want the kyverno-svc-metrics Service to be publicly exposed so as to expose the metrics (available at port 8000) to your external Prometheus server.
Services can be exposed to external clients via an Ingress, or using LoadBalancer or NodePort Service types.
To expose your kyverno-svc-metrics service publicly as NodePort at host’s/node’s port number 8000, you can configure your values.yaml before Helm installation as follows:
admissionController:  metricsService:    create: true    type: NodePort    port: 8000    nodePort: 8000  # ...
backgroundController:  metricsService:    create: true    type: NodePort    port: 8000    nodePort: 8000  # ...
cleanupController:  metricsService:    create: true    type: NodePort    port: 8000    nodePort: 8000  # ...
reportsController:  metricsService:    create: true    type: NodePort    port: 8000    nodePort: 8000  # ...
To expose the kyverno-svc-metrics service using a LoadBalancer type, you can configure your values.yaml before Helm installation as follows:
admissionController:  metricsService:    create: true    type: LoadBalancer    port: 8000    nodePort:  # ...
backgroundController:  metricsService:    create: true    type: LoadBalancer    port: 8000    nodePort:  # ...
cleanupController:  metricsService:    create: true    type: LoadBalancer    port: 8000    nodePort:  # ...
reportsController:  metricsService:    create: true    type: LoadBalancer    port: 8000  nodePort:  # ...
Configuring the metrics
Section titled “Configuring the metrics”While installing Kyverno via Helm, you also have the ability to configure which metrics to expose, this configuration will be stored in the kyverno-metrics ConfigMap.
You can configure which Namespaces you want to include and/or exclude for metric exportation when configuring your Helm chart. This configuration is useful in situations where you might want to exclude the exposure of Kyverno metrics for certain Namespaces like test or experimental Namespaces. Likewise, you can include certain Namespaces if you want to monitor Kyverno-related activity for only a set of certain critical Namespaces. Exporting the right set of Namespaces (as opposed to exposing all Namespaces) can end up substantially reducing the memory footprint of Kyverno’s metrics exporter. Moreover, you can also configure the exposure of specific metrics, disabling them completely or dropping some label dimensions. For Histograms, you can change the default bucket boundaries or configure it for a specific metric as well.
...metricsConfig:  # 'namespaces.include': list of namespaces to capture metrics for. Default: all namespaces included.  # 'namespaces.exclude': list of namespaces to NOT capture metrics for. Default: [], none of the namespaces excluded.  # `exclude` takes precedence over `include` in cases when a Namespace is provided under both.  namespaces:    include: []    exclude: []
  # Configures the bucket boundaries for all Histogram metrics, the value below is the default.  bucketBoundaries:    [0.005, 0.01, 0.025, 0.05, 0.1, 0.25, 0.5, 1, 2.5, 5, 10, 15, 20, 25, 30]
  # Per Metric configuration, allows disabling metrics, dropping labels and change the bucket boundaries.  # For detailed information about these metrics, see the [Metrics Reference](/docs/reference/metrics)  metricsExposure:    # Counter disabled    # See [Policies and Rules Count](/docs/reference/metrics#policies-and-rules-count) for details    kyverno_policy_rule_info_total:      enabled: false    # Histogram disabled    # See [Admission Review Latency](/docs/reference/metrics#admission-review-latency) for details    kyverno_admission_review_duration_seconds:      enabled: false    # Counter with customized dimensions    # See [Admission Requests Count](/docs/reference/metrics#admission-requests-count) for details    kyverno_admission_requests:      disabledLabelDimensions:        ['resource_namespace', 'resource_kind', 'resource_request_operation']    # Histogram with custom boundaries and dimensions    # See [Policy Rule Execution Latency](/docs/reference/metrics#policy-rule-execution-latency) for details    kyverno_policy_execution_duration_seconds:      disabledLabelDimensions:        ['resource_kind', 'resource_namespace', 'resource_request_operation']      bucketBoundaries: [0.005, 0.01, 0.025]...
Disabling metrics
Section titled “Disabling metrics”Some metrics may generate an excess amount of data which may be undesirable in situations where this incurs additional cost. Some monitoring products and solutions have the ability to selectively disable which metrics are sent to collectors while leaving others enabled.
Kyverno configuration side
Section titled “Kyverno configuration side”As described above, Kyverno allows disabling metrics, dropping labels and changing the bucket boundaries by changing the kyverno-metrics ConfigMap, please refer to the example provided.
DataDog OpenMetrics side
Section titled “DataDog OpenMetrics side”Disabling select metrics with DataDog OpenMetrics can be done by annotating the Kyverno Pod(s) as shown below.
Note: For detailed information about these metrics, see the Metrics Reference:
kyverno_policy_rule_info_total- Policies and Rules Countkyverno_admission_requests- Admission Requests Countkyverno_policy_changes- Policy Changes Countkyverno_policy_results- Policy and Rule Execution
apiVersion: v1kind: Podmetadata: annotations: ad.datadoghq.com/kyverno.checks: | { "openmetrics": { "init_config": {}, "instances": [ { "openmetrics_endpoint": "http://%%host%%:8000/metrics", "namespace": "kyverno", "metrics": [ {"kyverno_policy_rule_info_total": "policy_rule_info"}, {"kyverno_admission_requests": "admission_requests"}, {"kyverno_policy_changes": "policy_changes"} ], "exclude_labels": [ "resource_namespace" ] }, { "openmetrics_endpoint": "http://%%host%%:8000/metrics", "namespace": "kyverno", "metrics": [ {"kyverno_policy_results": "policy_results"} ] } ] } }The Kyverno Helm chart supports including additional Pod annotations in the values file as shown in the below example.
Note: For detailed information about these metrics, see the Metrics Reference:
kyverno_policy_rule_info_total- Policies and Rules Countkyverno_admission_requests- Admission Requests Countkyverno_policy_changes- Policy Changes Countkyverno_policy_results- Policy and Rule Execution
podAnnotations: # https://github.com/DataDog/integrations-core/blob/master/openmetrics/datadog_checks/openmetrics/data/conf.yaml.example # Note: To collect counter metrics with names ending in `_total`, specify the metric name without the `_total` ad.datadoghq.com/kyverno.checks: | { "openmetrics": { "init_config": {}, "instances": [ { "openmetrics_endpoint": "http://%%host%%:8000/metrics", "namespace": "kyverno", "metrics": [ {"kyverno_policy_rule_info_total": "policy_rule_info"}, {"kyverno_admission_requests": "admission_requests"}, {"kyverno_policy_changes": "policy_changes"} ], "exclude_labels": [ "resource_namespace" ] }, { "openmetrics_endpoint": "http://%%host%%:8000/metrics", "namespace": "kyverno", "metrics": [ {"kyverno_policy_results": "policy_results"} ] } ] } }OpenTelemetry Setup
Section titled “OpenTelemetry Setup”Setting up OpenTelemetry requires configuration of a few YAML files. The required configurations are listed below.
Install Cert-Manager
Section titled “Install Cert-Manager”Install Cert-Manager by following the documentation.
Config file for OpenTelemetry Collector
Section titled “Config file for OpenTelemetry Collector”Create a configmap.yaml file in the kyverno Namespace with the following content:
apiVersion: v1kind: ConfigMapmetadata: name: collector-config namespace: kyvernodata: collector.yaml: | receivers: otlp: protocols: grpc: endpoint: ":8000" processors: batch: send_batch_size: 10000 timeout: 5s extensions: health_check: {} exporters: jaeger: endpoint: "jaeger-collector.observability.svc.cluster.local:14250" tls: insecure: true prometheus: endpoint: ":9090" logging: loglevel: debug service: extensions: [health_check] pipelines: traces: receivers: [otlp] processors: [] exporters: [jaeger, logging] metrics: receivers: [otlp] processors: [batch] exporters: [prometheus, logging]- Here the Prometheus exporter endpoint is set as 9090 which means Prometheus will be able to scrape this service on the given endpoint to collect metrics.
- Similarly, the Jaeger endpoint references a Jaeger collector at the default Jaeger endpoint 14250.
The Collector Deployment
Section titled “The Collector Deployment”Create a deployment.yaml file in the kyverno Namespace with the following content:
apiVersion: apps/v1kind: Deploymentmetadata: name: opentelemetrycollector namespace: kyvernospec: replicas: 1 selector: matchLabels: app.kubernetes.io/name: opentelemetrycollector template: metadata: labels: app.kubernetes.io/name: opentelemetrycollector spec: containers: - name: otelcol args: - --config=/conf/collector.yaml image: otel/opentelemetry-collector:0.50.0 volumeMounts: - name: collector-config mountPath: /conf volumes: - configMap: name: collector-config items: - key: collector.yaml path: collector.yaml name: collector-configThis references the collector defined in the configmap.yaml above. Here we are using a Deployment with just a single replica. Ideally, a DaemonSet is preferred. Check the OpenTelemetry documentation for more deployment strategies.
The Collector Service
Section titled “The Collector Service”Finally, create a service.yaml file in the kyverno Namespace with the following content:
apiVersion: v1kind: Servicemetadata: name: opentelemetrycollector namespace: kyvernospec: ports: - name: otlp-grpc port: 8000 protocol: TCP targetPort: 8000 - name: metrics port: 9090 protocol: TCP targetPort: 9090 selector: app.kubernetes.io/name: opentelemetrycollector type: ClusterIPThis defines a Service for the discovery of the collector Deployment.
Setting up Kyverno and passing required flags
Section titled “Setting up Kyverno and passing required flags”See the installation instructions for Kyverno. Depending on the method used, the following flags must be passed.
- Pass the flag
metricsPortto defined the OpenTelemetry Collector endpoint for collecting metrics. - Pass the flag
otelConfig=grpcto export the metrics and traces to an OpenTelemetry collector on the metrics port endpoint
Setting up a secure connection between Kyverno and the collector
Section titled “Setting up a secure connection between Kyverno and the collector”Kyverno also supports setting up a secure connection with the OpenTelemetry exporter using TLS on the server-side (on the collector). This will require you to create a certificate-key pair for the OpenTelemetry collector from some private CA and then saving the certificate as a Secret in your Kyverno Namespace with key named ca.pem.
Considering you already have the server.pem and server-key.pem files along with the ca.pem file (you can configure these using a tool such as OepnSSL or cfssl). Your OpenTelemetry configmap.yaml and deployment.yaml files will also change accordingly:
configmap.yaml
apiVersion: v1kind: ConfigMapmetadata: name: collector-config namespace: kyvernodata: collector.yaml: | receivers: otlp: protocols: grpc: endpoint: ":8000" tls: cert_file: /etc/ssl/certs/server/server.pem key_file: /etc/ssl/certs/server/server-key.pem ca_file: /etc/ssl/certs/ca/ca.pem processors: batch: send_batch_size: 10000 timeout: 5s extensions: health_check: {} exporters: jaeger: endpoint: "jaeger-collector.observability.svc.cluster.local:14250" tls: insecure: true prometheus: endpoint: ":9090" logging: loglevel: debug service: extensions: [health_check] pipelines: traces: receivers: [otlp] processors: [] exporters: [jaeger, logging] metrics: receivers: [otlp] processors: [batch] exporters: [prometheus, logging]deployment.yaml
apiVersion: apps/v1kind: Deploymentmetadata: name: opentelemetrycollector namespace: kyvernospec: replicas: 1 selector: matchLabels: app.kubernetes.io/name: opentelemetrycollector template: metadata: labels: app.kubernetes.io/name: opentelemetrycollector spec: containers: - name: otelcol args: - --config=/conf/collector.yaml image: otel/opentelemetry-collector:0.50.0 volumeMounts: - name: collector-config mountPath: /conf - name: otel-collector-secrets mountPath: /etc/ssl/certs/server - name: root-ca mountPath: /etc/ssl/certs/ca volumes: - configMap: name: collector-config items: - key: collector.yaml path: collector.yaml name: collector-config - secret: secretName: otel-collector-secrets name: otel-collector-secrets - secret: secretName: root-ca name: root-caThis will ensure that the OpenTelemetry collector can only accept encrypted data on the receiver endpoint.
Pass the flag transportCreds as the Secret name containing the ca.pem file (Empty string means insecure connection will be used).
Setting up Prometheus
Section titled “Setting up Prometheus”- For the metrics backend, you can install Prometheus on you cluster. For a general example, we have a ready-made configuration for you. Install Prometheus by running:
kubectl apply -k github.com/kyverno/grafana-dashboard/examples/prometheus- Port-forward the Prometheus service to view the metrics on localhost.
kubectl port-forward svc/prometheus-server 9090:9090 -n kyvernoSetting up Jaeger
Section titled “Setting up Jaeger”The traces are pushed to the Jaeger backend on port 14250. To install Jaeger:
First install the Jaeger Operator. Replace the version as needed.
kubectl create namespace observabilitykubectl create -n observability -f https://github.com/jaegertracing/jaeger-operator/releases/download/v1.33.0/jaeger-operator.yamlkubectl wait --for=condition=Available deployment --timeout=2m -n observability --allCreate a Jaeger resource configuration as shown below
jaeger.yaml
apiVersion: jaegertracing.io/v1kind: Jaegermetadata: name: jaeger namespace: observabilityInstall the Jaeger backend
kubectl create -f jaeger.yamlPort-forward the Jaeger Service on 16686 to view the traces.
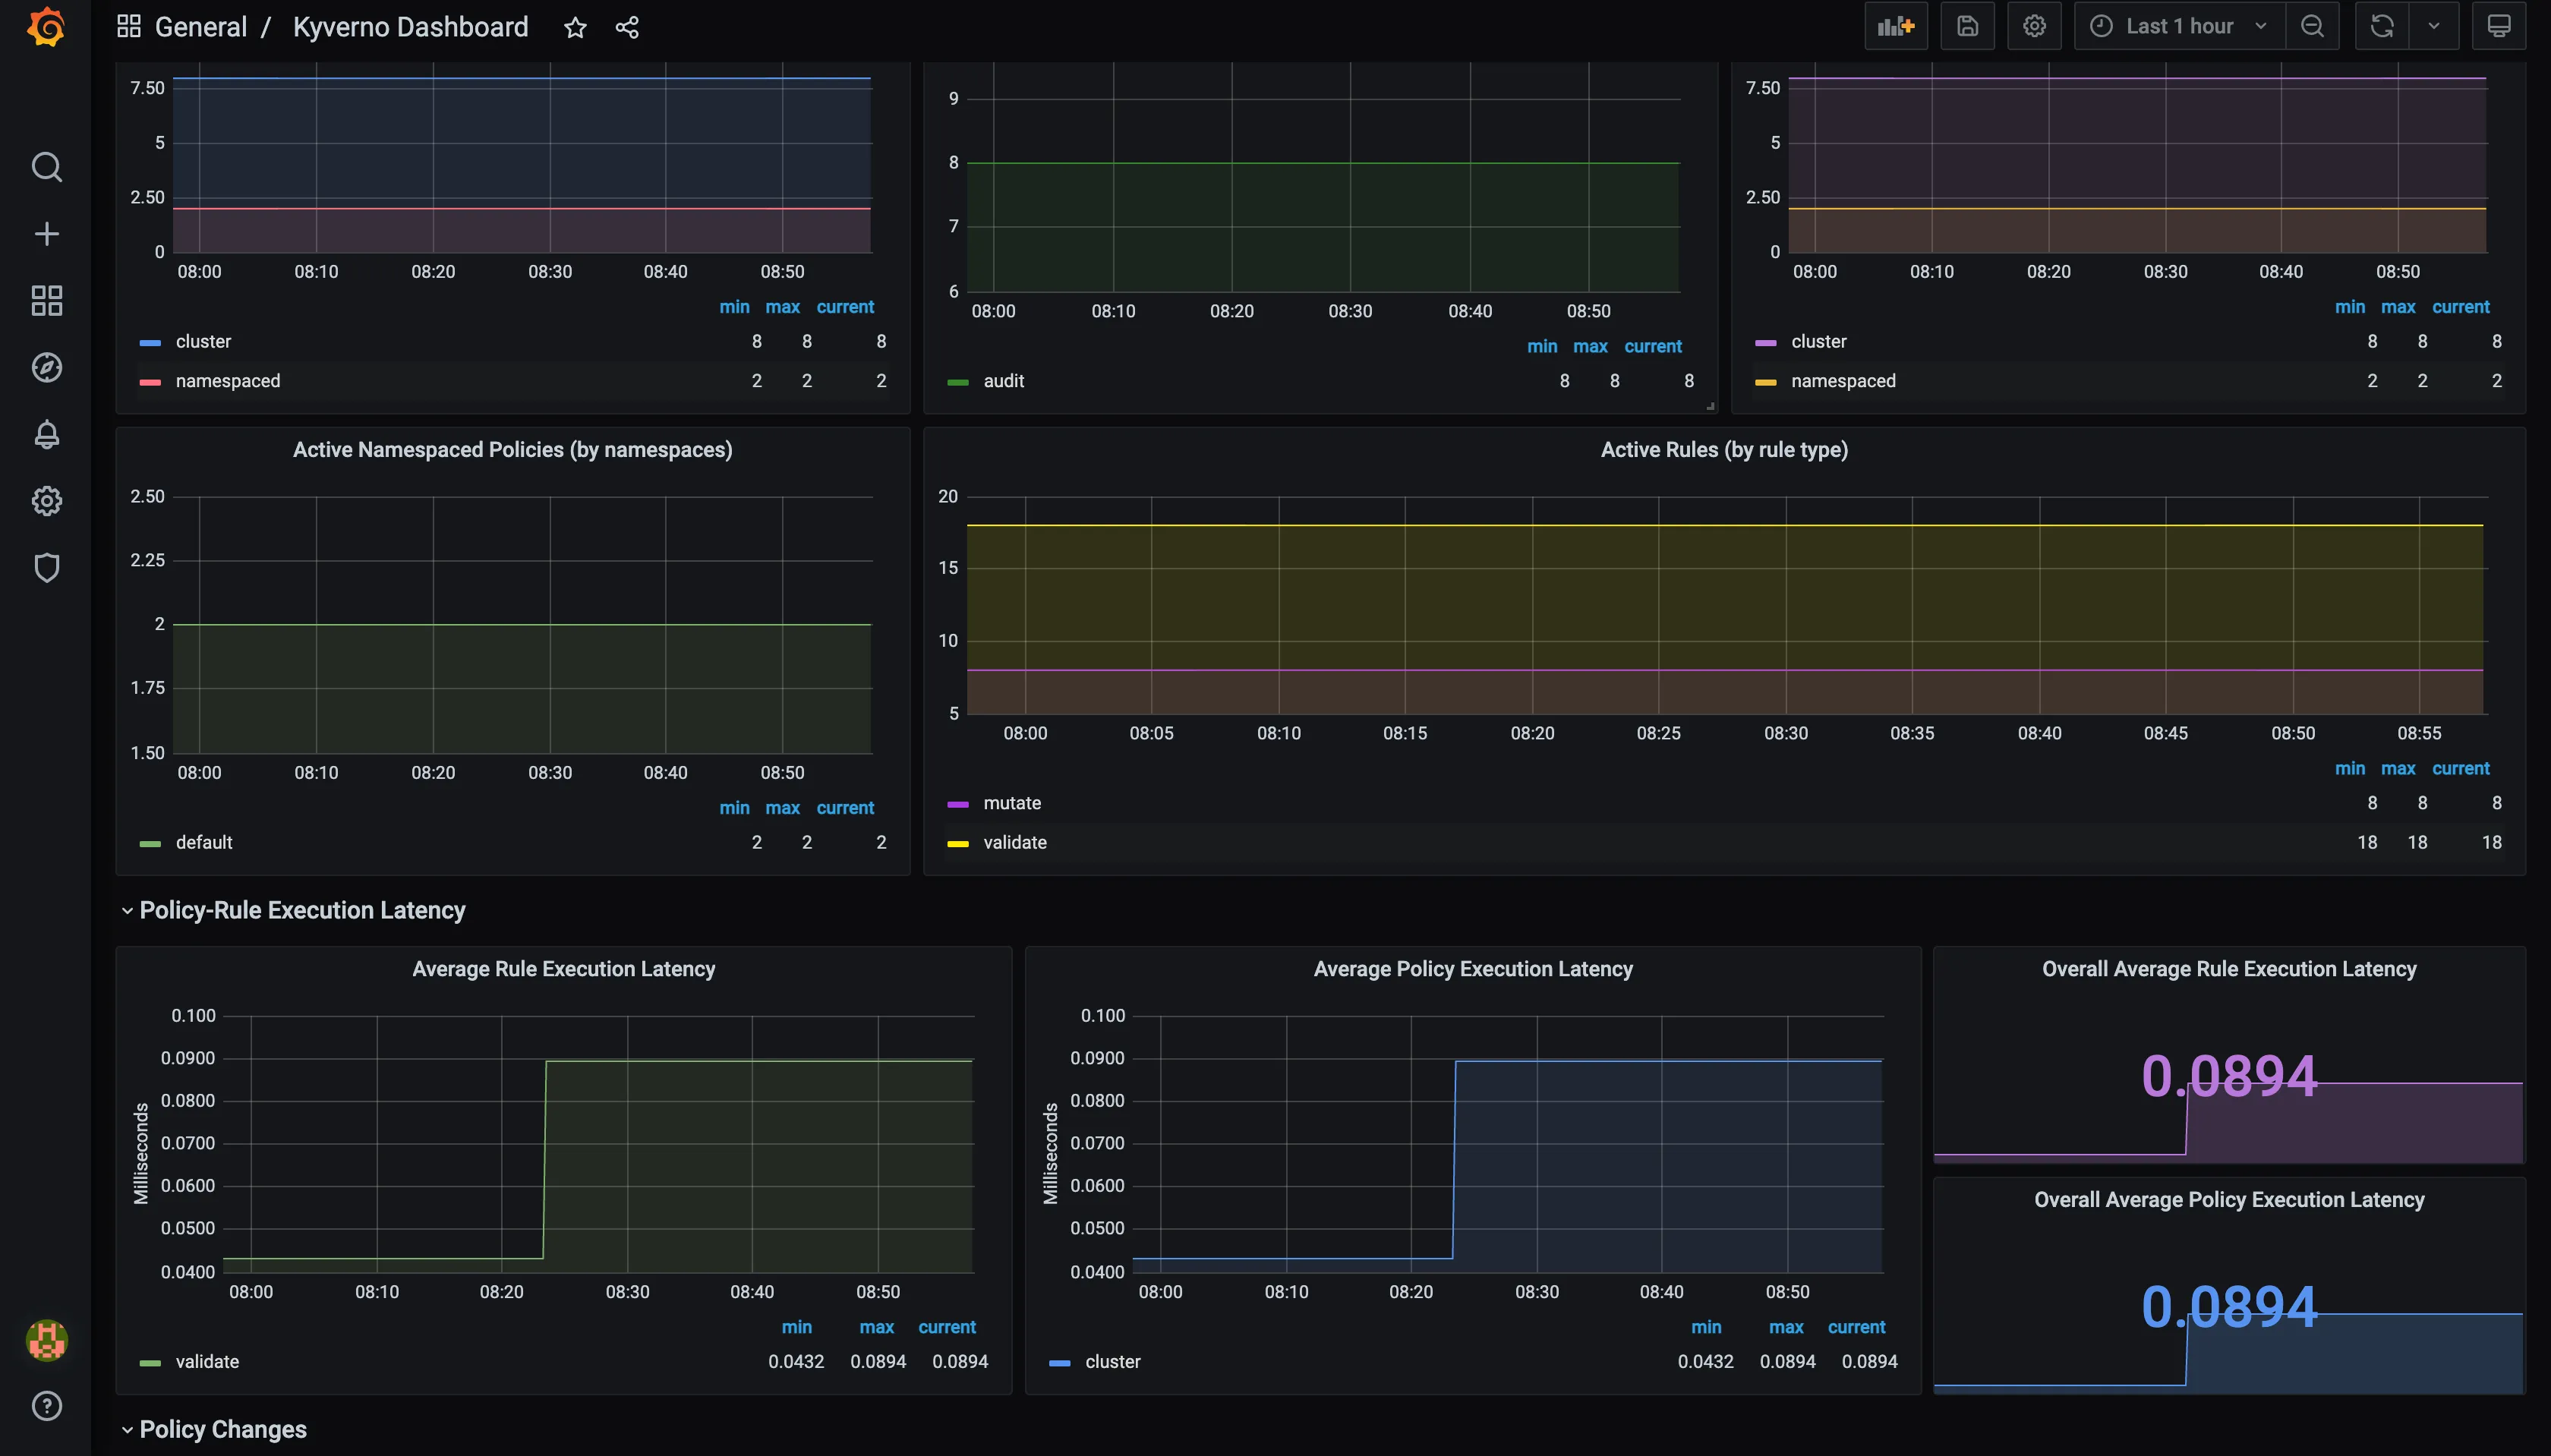
kubectl port-forward svc/jaeger-query 16686:16686 -n observabilityGrafana Dashboard
Section titled “Grafana Dashboard”With Helm Chart
Section titled “With Helm Chart”- If your Grafana is configured with the discovery sidecar, set
grafana.enabledvalue totrue. - If you’re using Grafana Operator, set
grafana.enabledtotrueandgrafana.grafanaDashboard.enabledvalue totrue.
See more configuration options here.
Without Helm Chart
Section titled “Without Helm Chart”- Download the dashboard’s JSON and save it in
kyverno-dashboard.json
curl -fsS https://raw.githubusercontent.com/kyverno/kyverno/main/charts/kyverno/charts/grafana/dashboard/kyverno-dashboard.json -o kyverno-dashboard.json- Open your Grafana portal and go to the option of importing a dashboard.
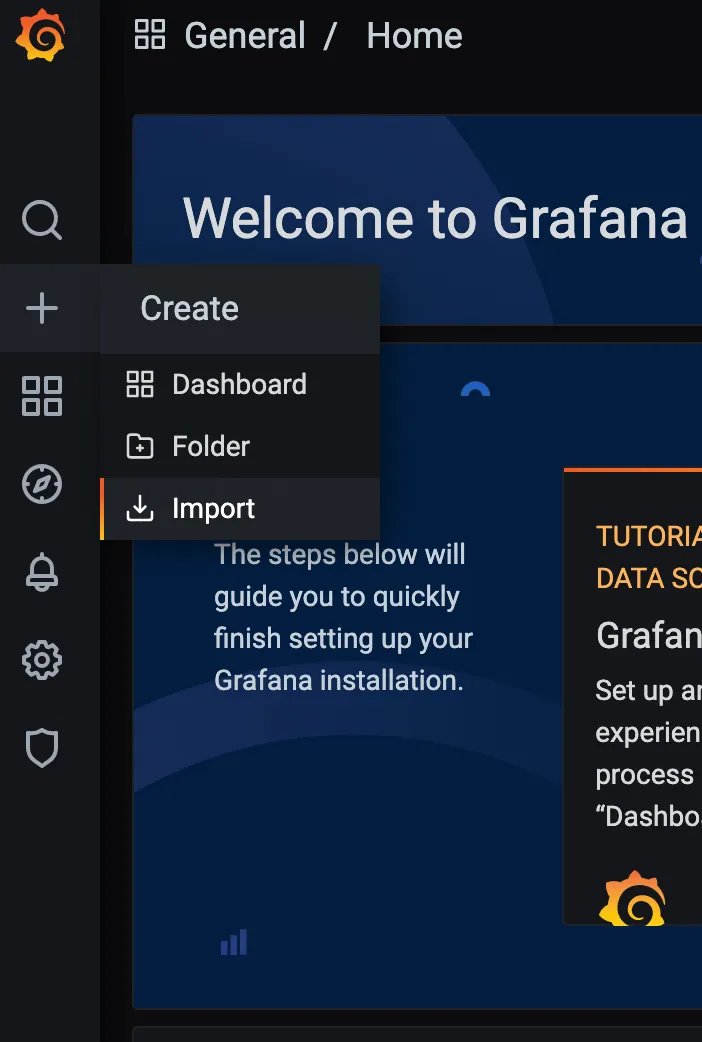
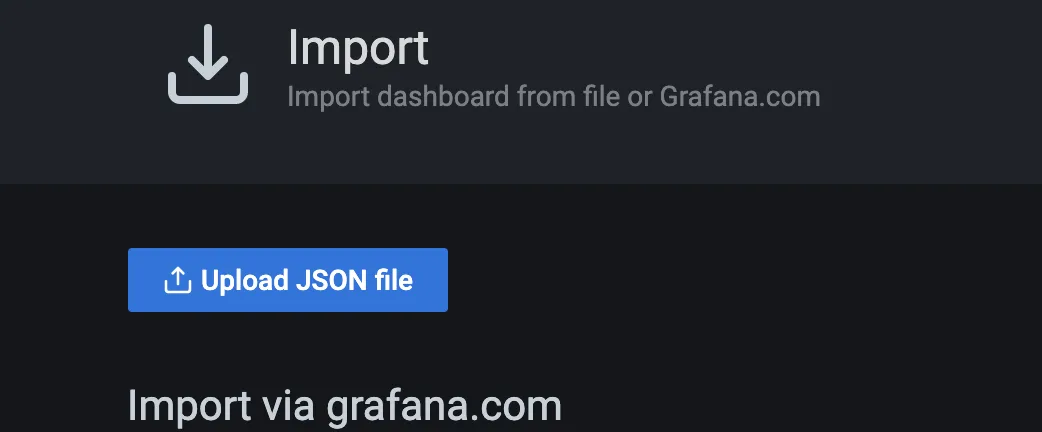
- Go to the “Upload JSON file” button, select the
kyverno-dashboard.jsonwhich you got in the first step and click on Import.
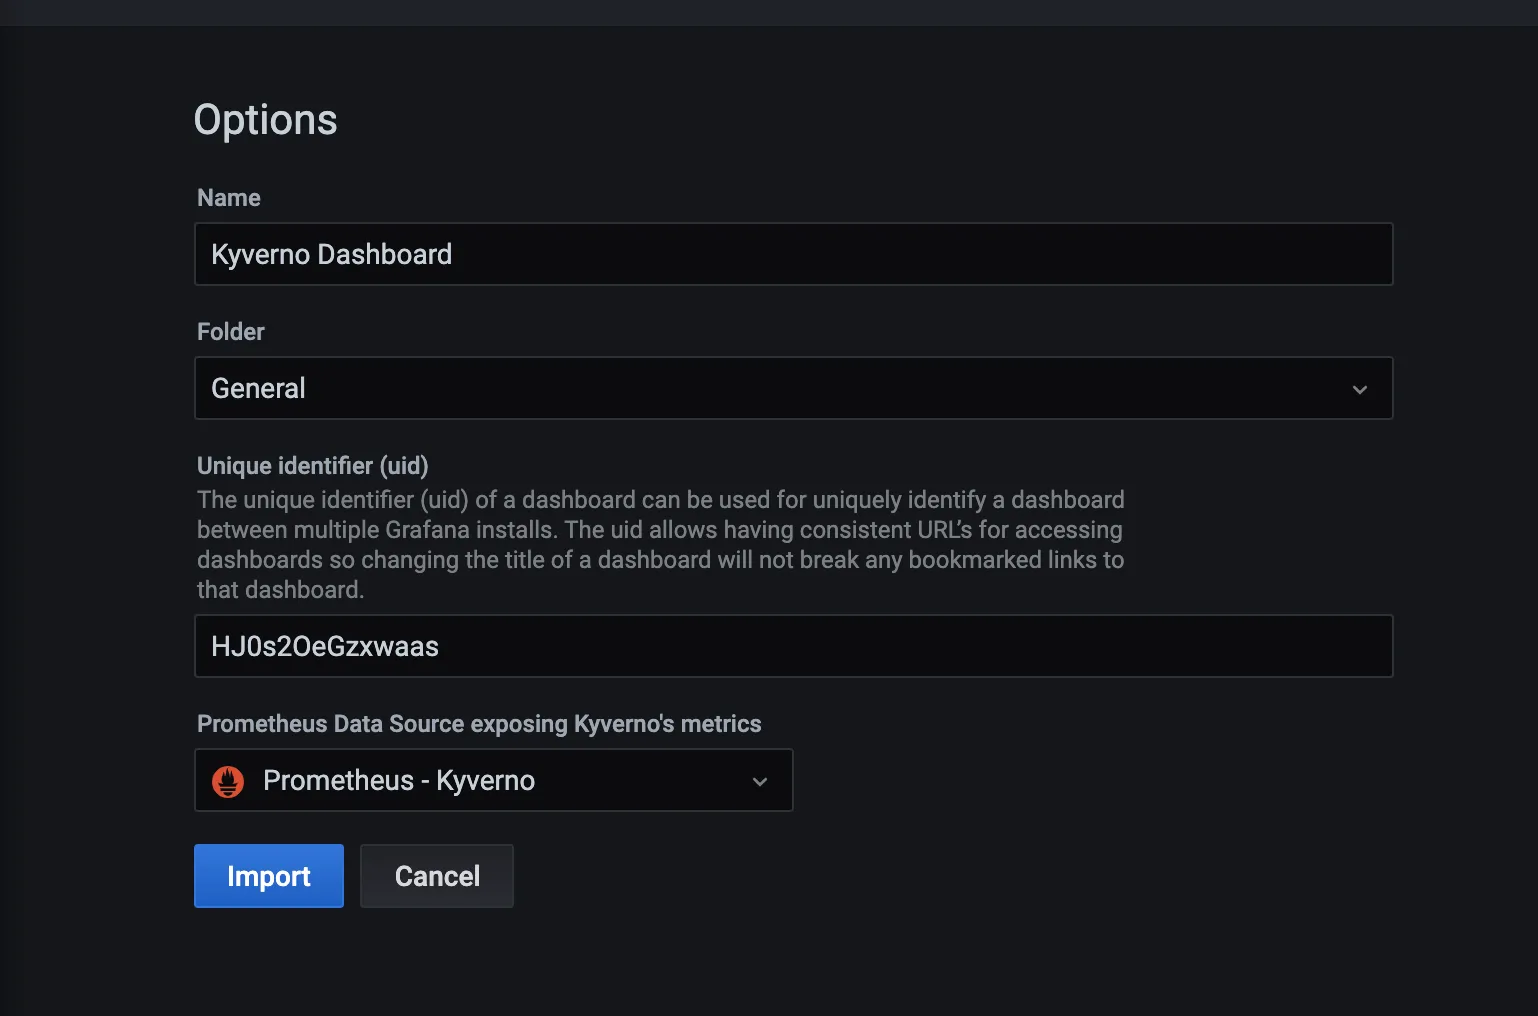
- Configure the fields according to your preferences and click on Import.
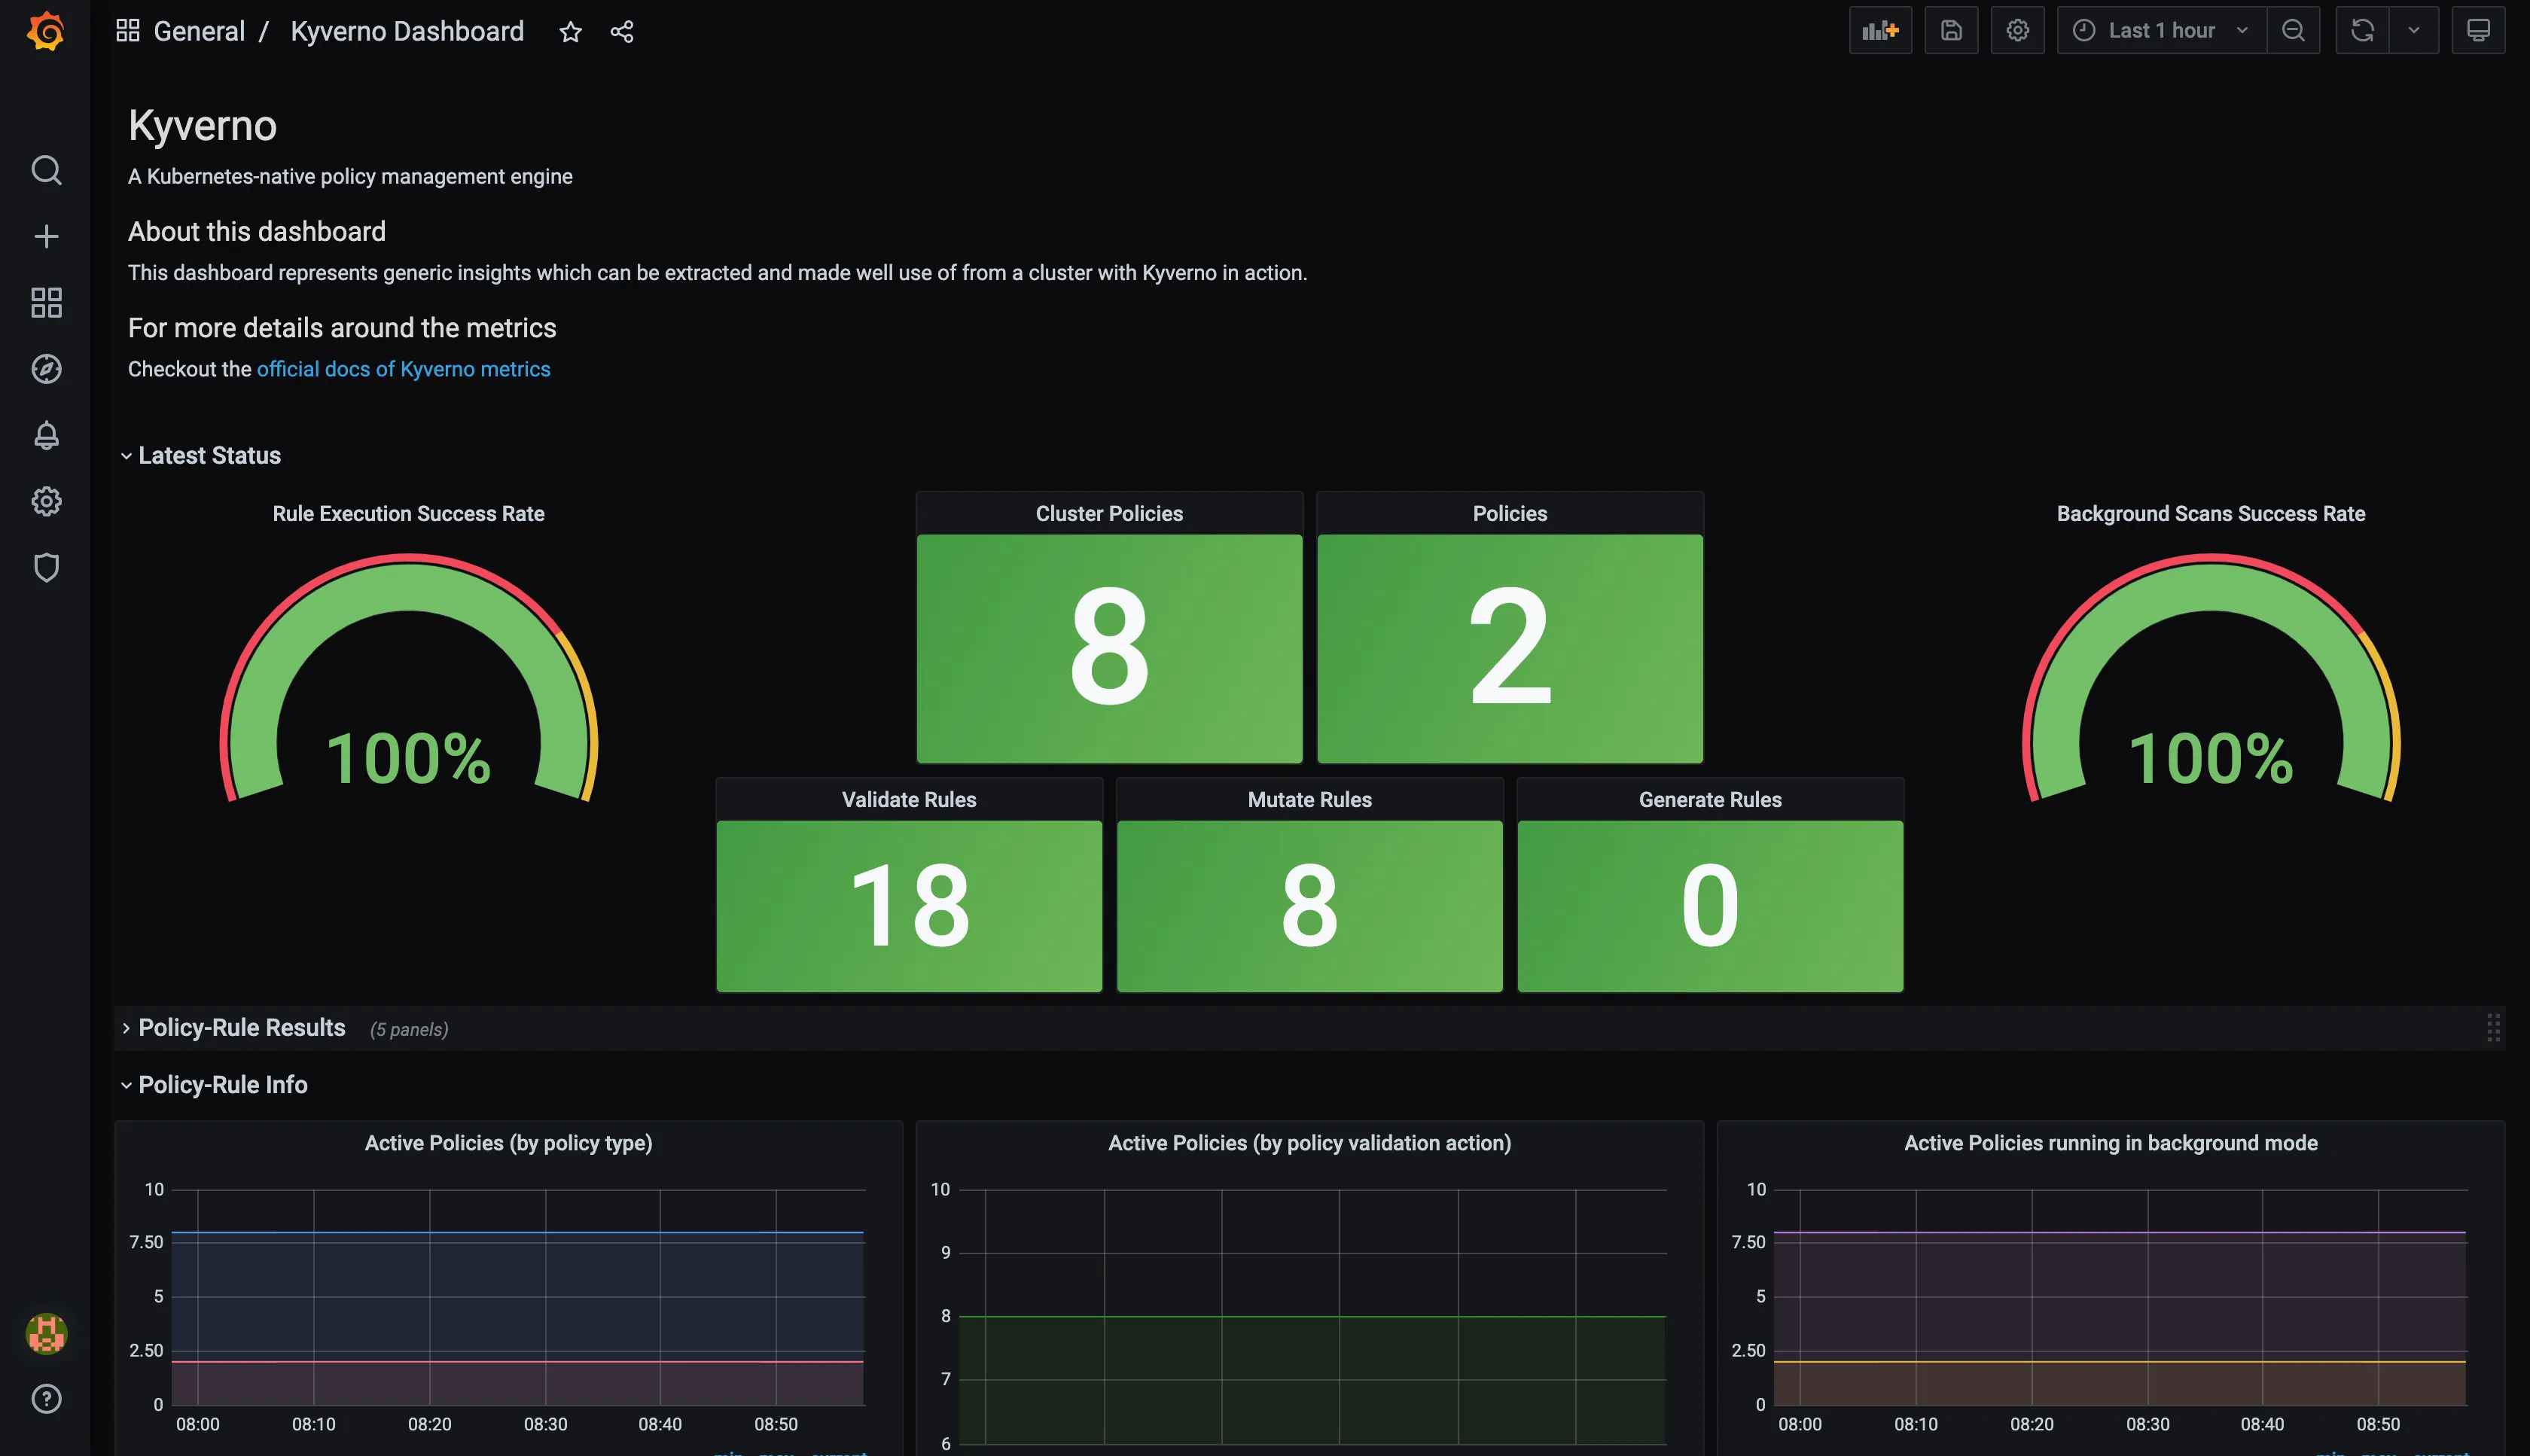
- And your dashboard will be ready in front of you.
Tutorial
Section titled “Tutorial”kind create clusterAdd Helm repositories.
helm repo add prometheus-community https://prometheus-community.github.io/helm-chartshelm repo add kyverno https://kyverno.github.io/kyverno/Update Helm repositories.
helm repo updateInstall Kyverno and the kube-prometheus-stack Helm chart.
helm install kyverno kyverno/kyverno --namespace kyverno --create-namespacehelm install monitoring prometheus-community/kube-prometheus-stack -n monitoring --create-namespace
kubectl -n monitoring get po -l "release"
Create the ServiceMonitor resource.
Add the following contents to a file named service-monitor.yaml.
apiVersion: monitoring.coreos.com/v1kind: ServiceMonitormetadata: labels: app.kubernetes.io/instance: monitoring chart: kube-prometheus-stack-51.2.0 heritage: Helm release: monitoring name: service-monitor-kyverno-service namespace: monitoringspec: endpoints: - interval: 60s path: /metrics scheme: http targetPort: 8000 tlsConfig: insecureSkipVerify: true namespaceSelector: matchNames: - kyverno selector: matchLabels: app.kubernetes.io/instance: kyvernoAdd the appropriate labels.
kubectl label ns kyverno app.kubernetes.io/instance=kyvernokubectl label ns kyverno app.kubernetes.io/name=kyvernoCreate the ServiceMonitor.
kubectl apply -f service-monitor.yamlRestart Deployments and StatefulSets in the monitoring Namespace.
kubectl rollout restart deploy,sts -n monitoringCheck services in the monitoring Namespace.
kubectl get svc -n monitoring
NAME                                      TYPE        CLUSTER-IP      EXTERNAL-IP   PORT(S)                      AGEmonitoring-kube-prometheus-prometheus     ClusterIP   10.96.238.189   <none>        9090/TCP,8080/TCP            4h16m
Port forward the monitoring-kube-prometheus-prometheus Service to a local port.
kubectl port-forward svc/monitoring-kube-prometheus-prometheus 81:9090 -n monitoring
Forwarding from 127.0.0.1:81 -> 9090Forwarding from [::1]:81 -> 9090
Similarly, port forward the monitoring-grafana Service to another local port.
kubectl get svc -n monitoring
NAME                                      TYPE        CLUSTER-IP      EXTERNAL-IP   PORT(S)                      AGEmonitoring-grafana                        ClusterIP   10.96.188.20    <none>        80/TCP                       4h19m
kubectl port-forward svc/monitoring-grafana -n monitoring 82:3000
Forwarding from 127.0.0.1:82 -> 3000Forwarding from [::1]:82 -> 3000
Go to Prometheus on port 9090 and check status -> Targets -> Filter for kyverno (to see if metrics are getting scraped)
Go to Grafana on port 3000 -> Dashboards -> New -> import -> Upload file that you get from running the below command -> Data type = Prometheus -> import
curl https://raw.githubusercontent.com/kyverno/grafana-dashboard/master/grafana/dashboard.json -o kyverno-dashboard.json