Tracing Tutorial with Grafana Tempo
A short proof-of-concept tutorial of tracing using Grafana Tempo.
Tracing is a method of tracking application requests as they are processed by the application software. When a software is instrumented it produces traces, traces are made of spans hierarchically organised to form a trace. Spans are defined by a start and end time, eventually a parent span, and a number of properties that define the span characteristics (client spans, server spans, etc…).
Tracing is not limited to a single application, as the tracing context can be transmitted on the wire it is possible to collect spans from multiple applications and reconcile them in a single trace.
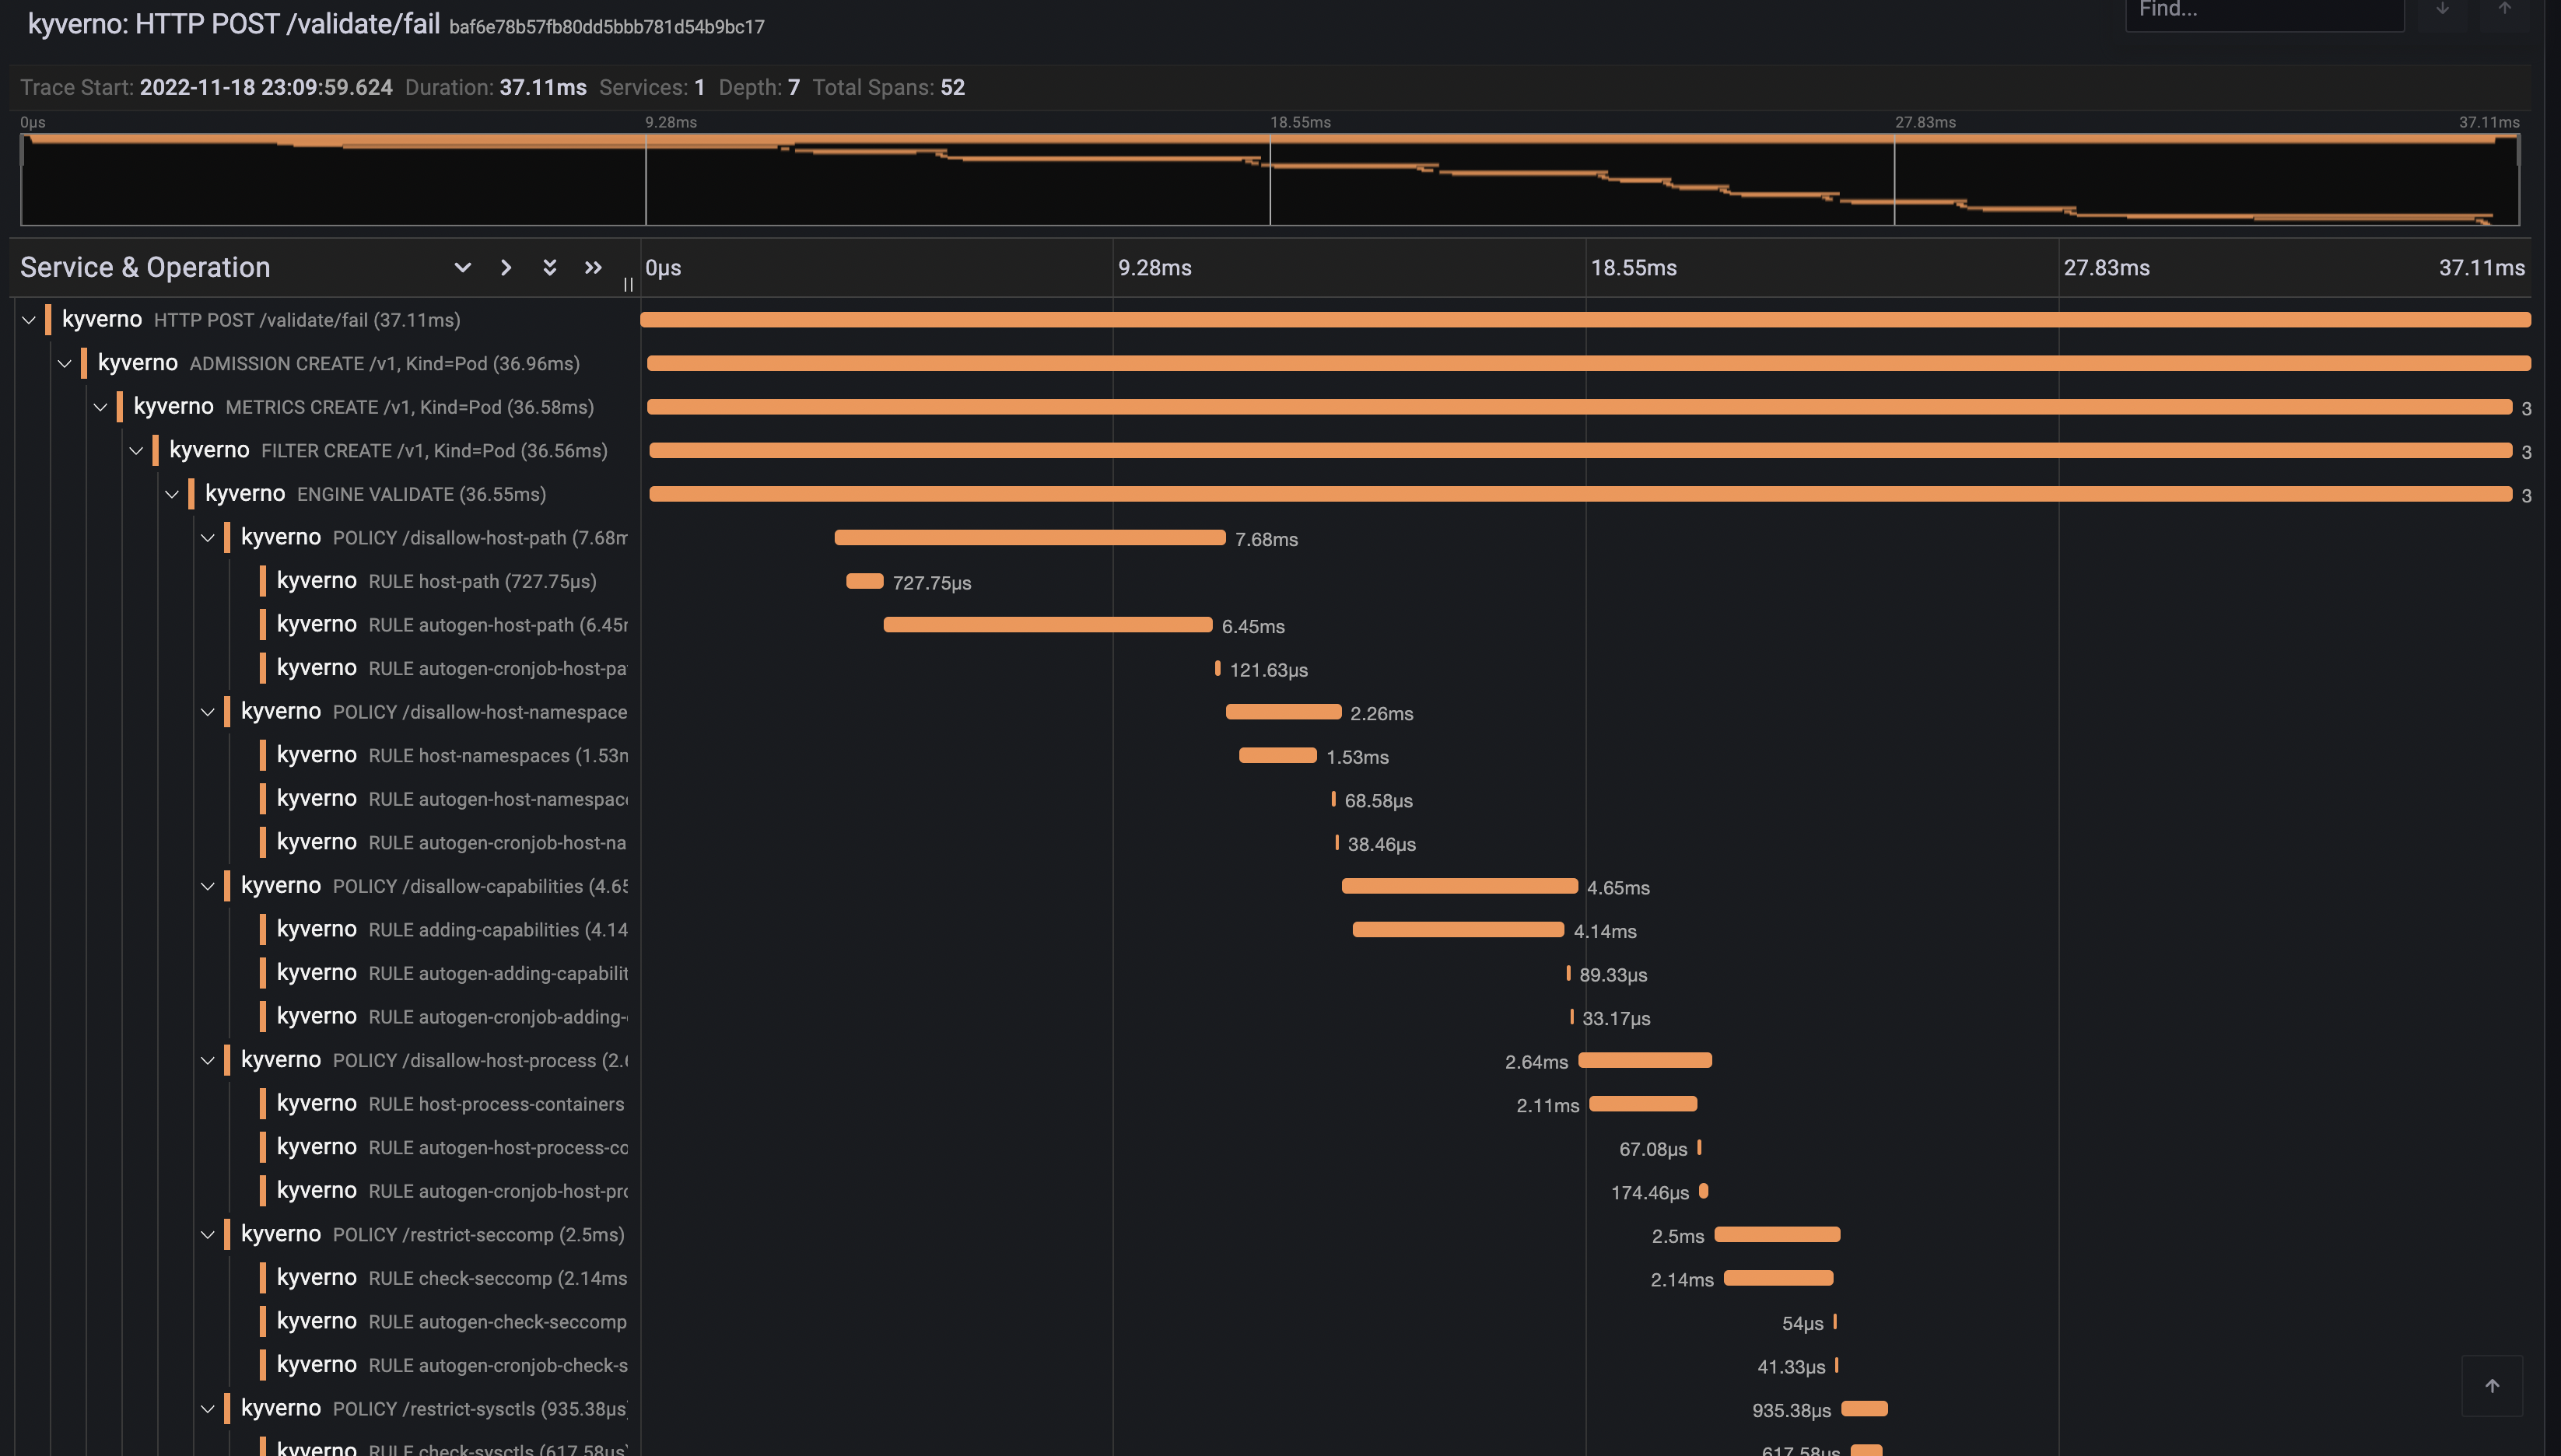
In the context of Kyverno, requests are usually sent by the Kubernetes API server to the Kyverno service during the admission phase. Kyverno receives and processes admission requests according to the configured policies. Every step in the admission pipeline and during the engine policy processing will produce spans. All clients (Kubernetes client, registry client and cosign client) have also been instrumented to produce client spans and transmit the tracing context on the wire.
Below is a trace for a validating admission request.
Tracing requires a backend where Kyverno will send traces. Kyverno uses OpenTelemetry for instrumentation and supports various backends like Jaeger, Grafana Tempo or Datadog to name a few.
When you install Kyverno via Helm, you need to set a couple of values to enable tracing.
 1$ values.yaml
 2
 3# ...
 4
 5# Enable tracing in the admission controller
 6admissionController:
 7  tracing:
 8    # -- Enable tracing
 9    enabled: true
10    # -- Traces receiver address
11    address: <backend url>
12    # -- Traces receiver port
13    port: 4317
14
15# ...
16
17# Enable tracing in the background controller
18backgroundController:
19  tracing:
20    # -- Enable tracing
21    enabled: true
22    # -- Traces receiver address
23    address: <backend url>
24    # -- Traces receiver port
25    port: 4317
26
27# ...
28
29# Enable tracing in the cleanup controller
30cleanupController:
31  tracing:
32    # -- Enable tracing
33    enabled: true
34    # -- Traces receiver address
35    address: <backend url>
36    # -- Traces receiver port
37    port: 4317
38
39# ...
40
41# Enable tracing in the reports controller
42reportsController:
43  tracing:
44    # -- Enable tracing
45    enabled: true
46    # -- Traces receiver address
47    address: <backend url>
48    # -- Traces receiver port
49    port: 4317
50
51# ...
Tracing is disabled by default and depending on the backend the associated cost can be significant.
Currently, Kyverno tracing is configured to sample all incoming requests, there’s no way to configure the tracing sampler directly in Kyverno. OpenTelemetry Collector can be used to take better sampling decision at the cost of a more advanced setup.
A short proof-of-concept tutorial of tracing using Grafana Tempo.
A short proof-of-concept tutorial of tracing using Jaeger.
Was this page helpful?
Glad to hear it! Please tell us how we can improve.
Sorry to hear that. Please tell us how we can improve.