Grafana Dashboard
Grafana Dashboard
Setup
With Helm Chart
- If your Grafana is configured with the discovery sidecar, set
grafana.enabledvalue totrue. - If you’re using Grafana Operator, set
grafana.enabledtotrueandgrafana.grafanaDashboard.enabledvalue totrue.
See more configuration options here.
Without Helm Chart
- Download the dashboard’s JSON and save it in
kyverno-dashboard.json
1curl -fsS https://raw.githubusercontent.com/kyverno/kyverno/main/charts/kyverno/charts/grafana/dashboard/kyverno-dashboard.json -o kyverno-dashboard.json
- Open your Grafana portal and go to the option of importing a dashboard.
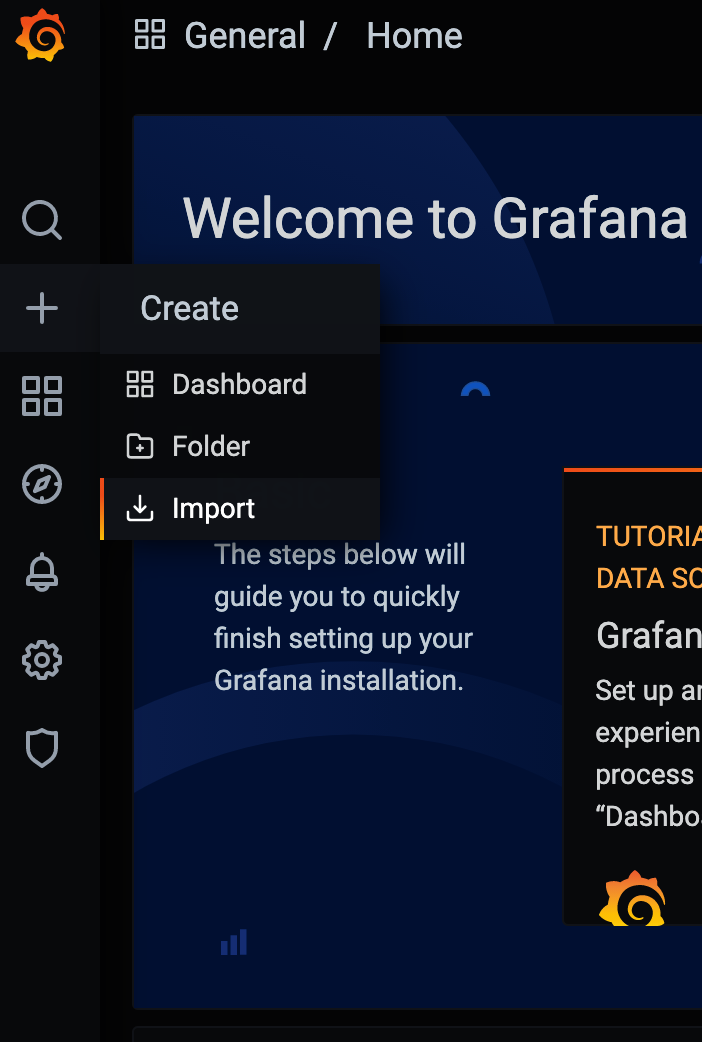
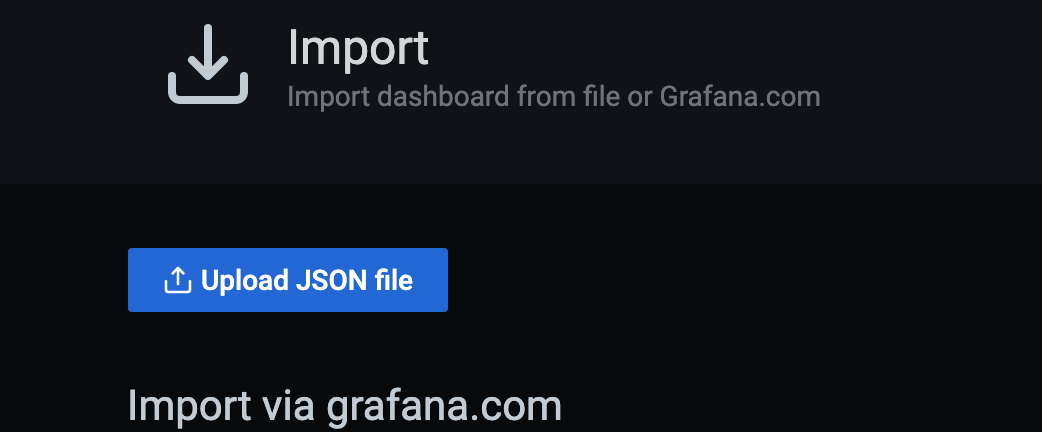
- Go to the “Upload JSON file” button, select the
kyverno-dashboard.jsonwhich you got in the first step and click on Import.
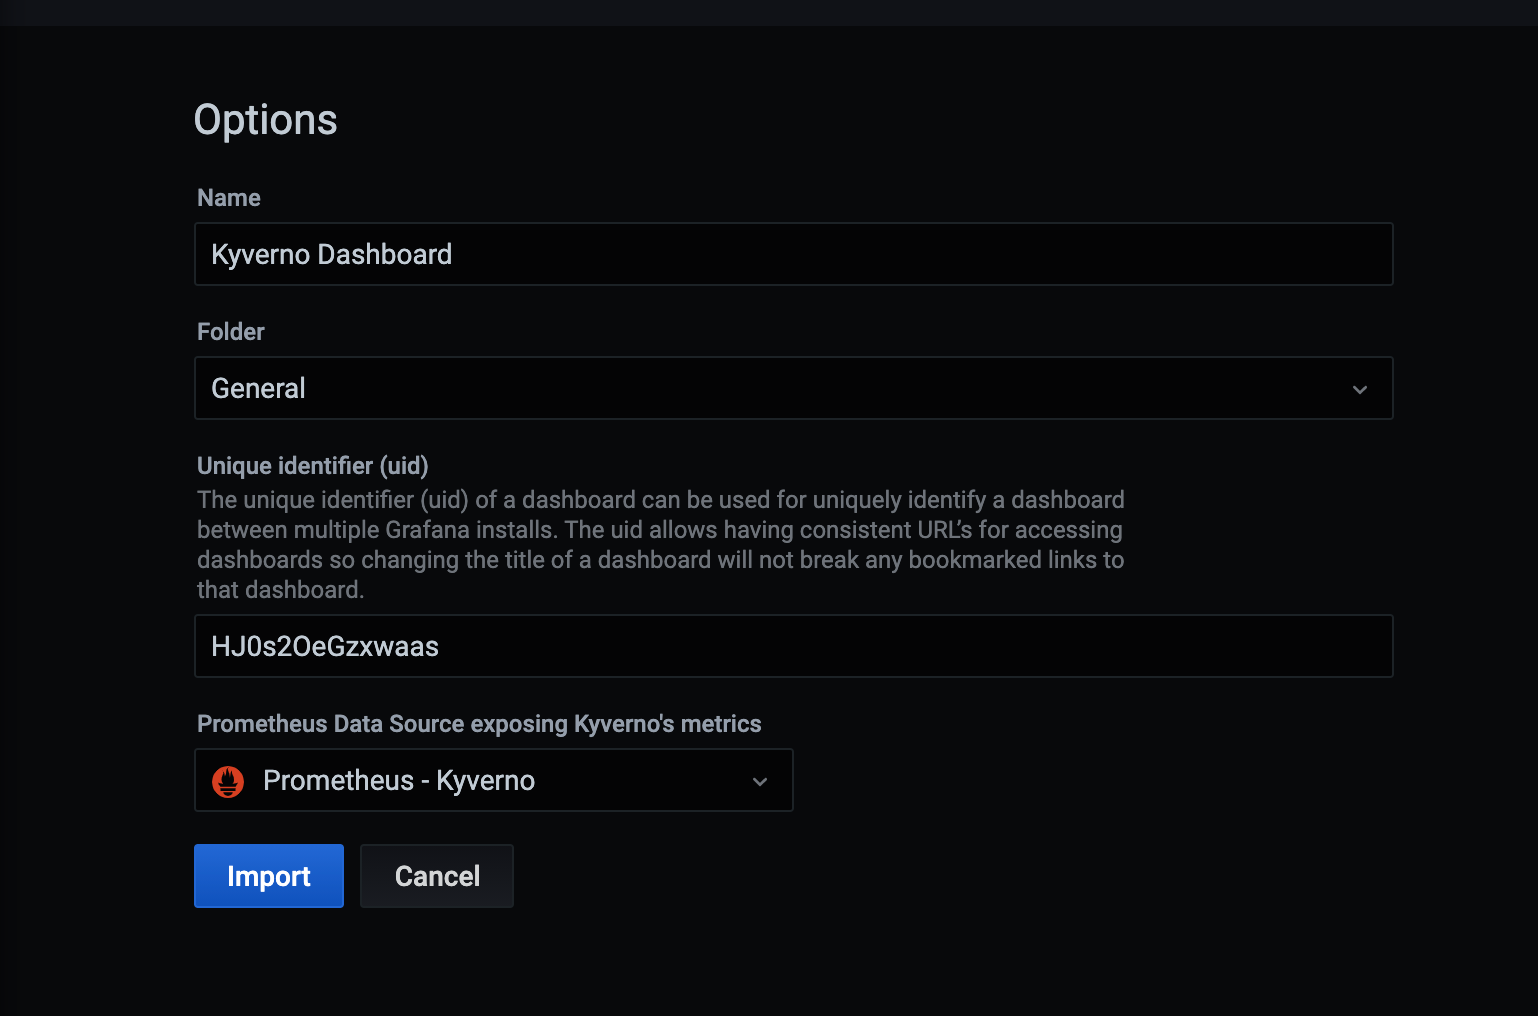
- Configure the fields according to your preferences and click on Import.
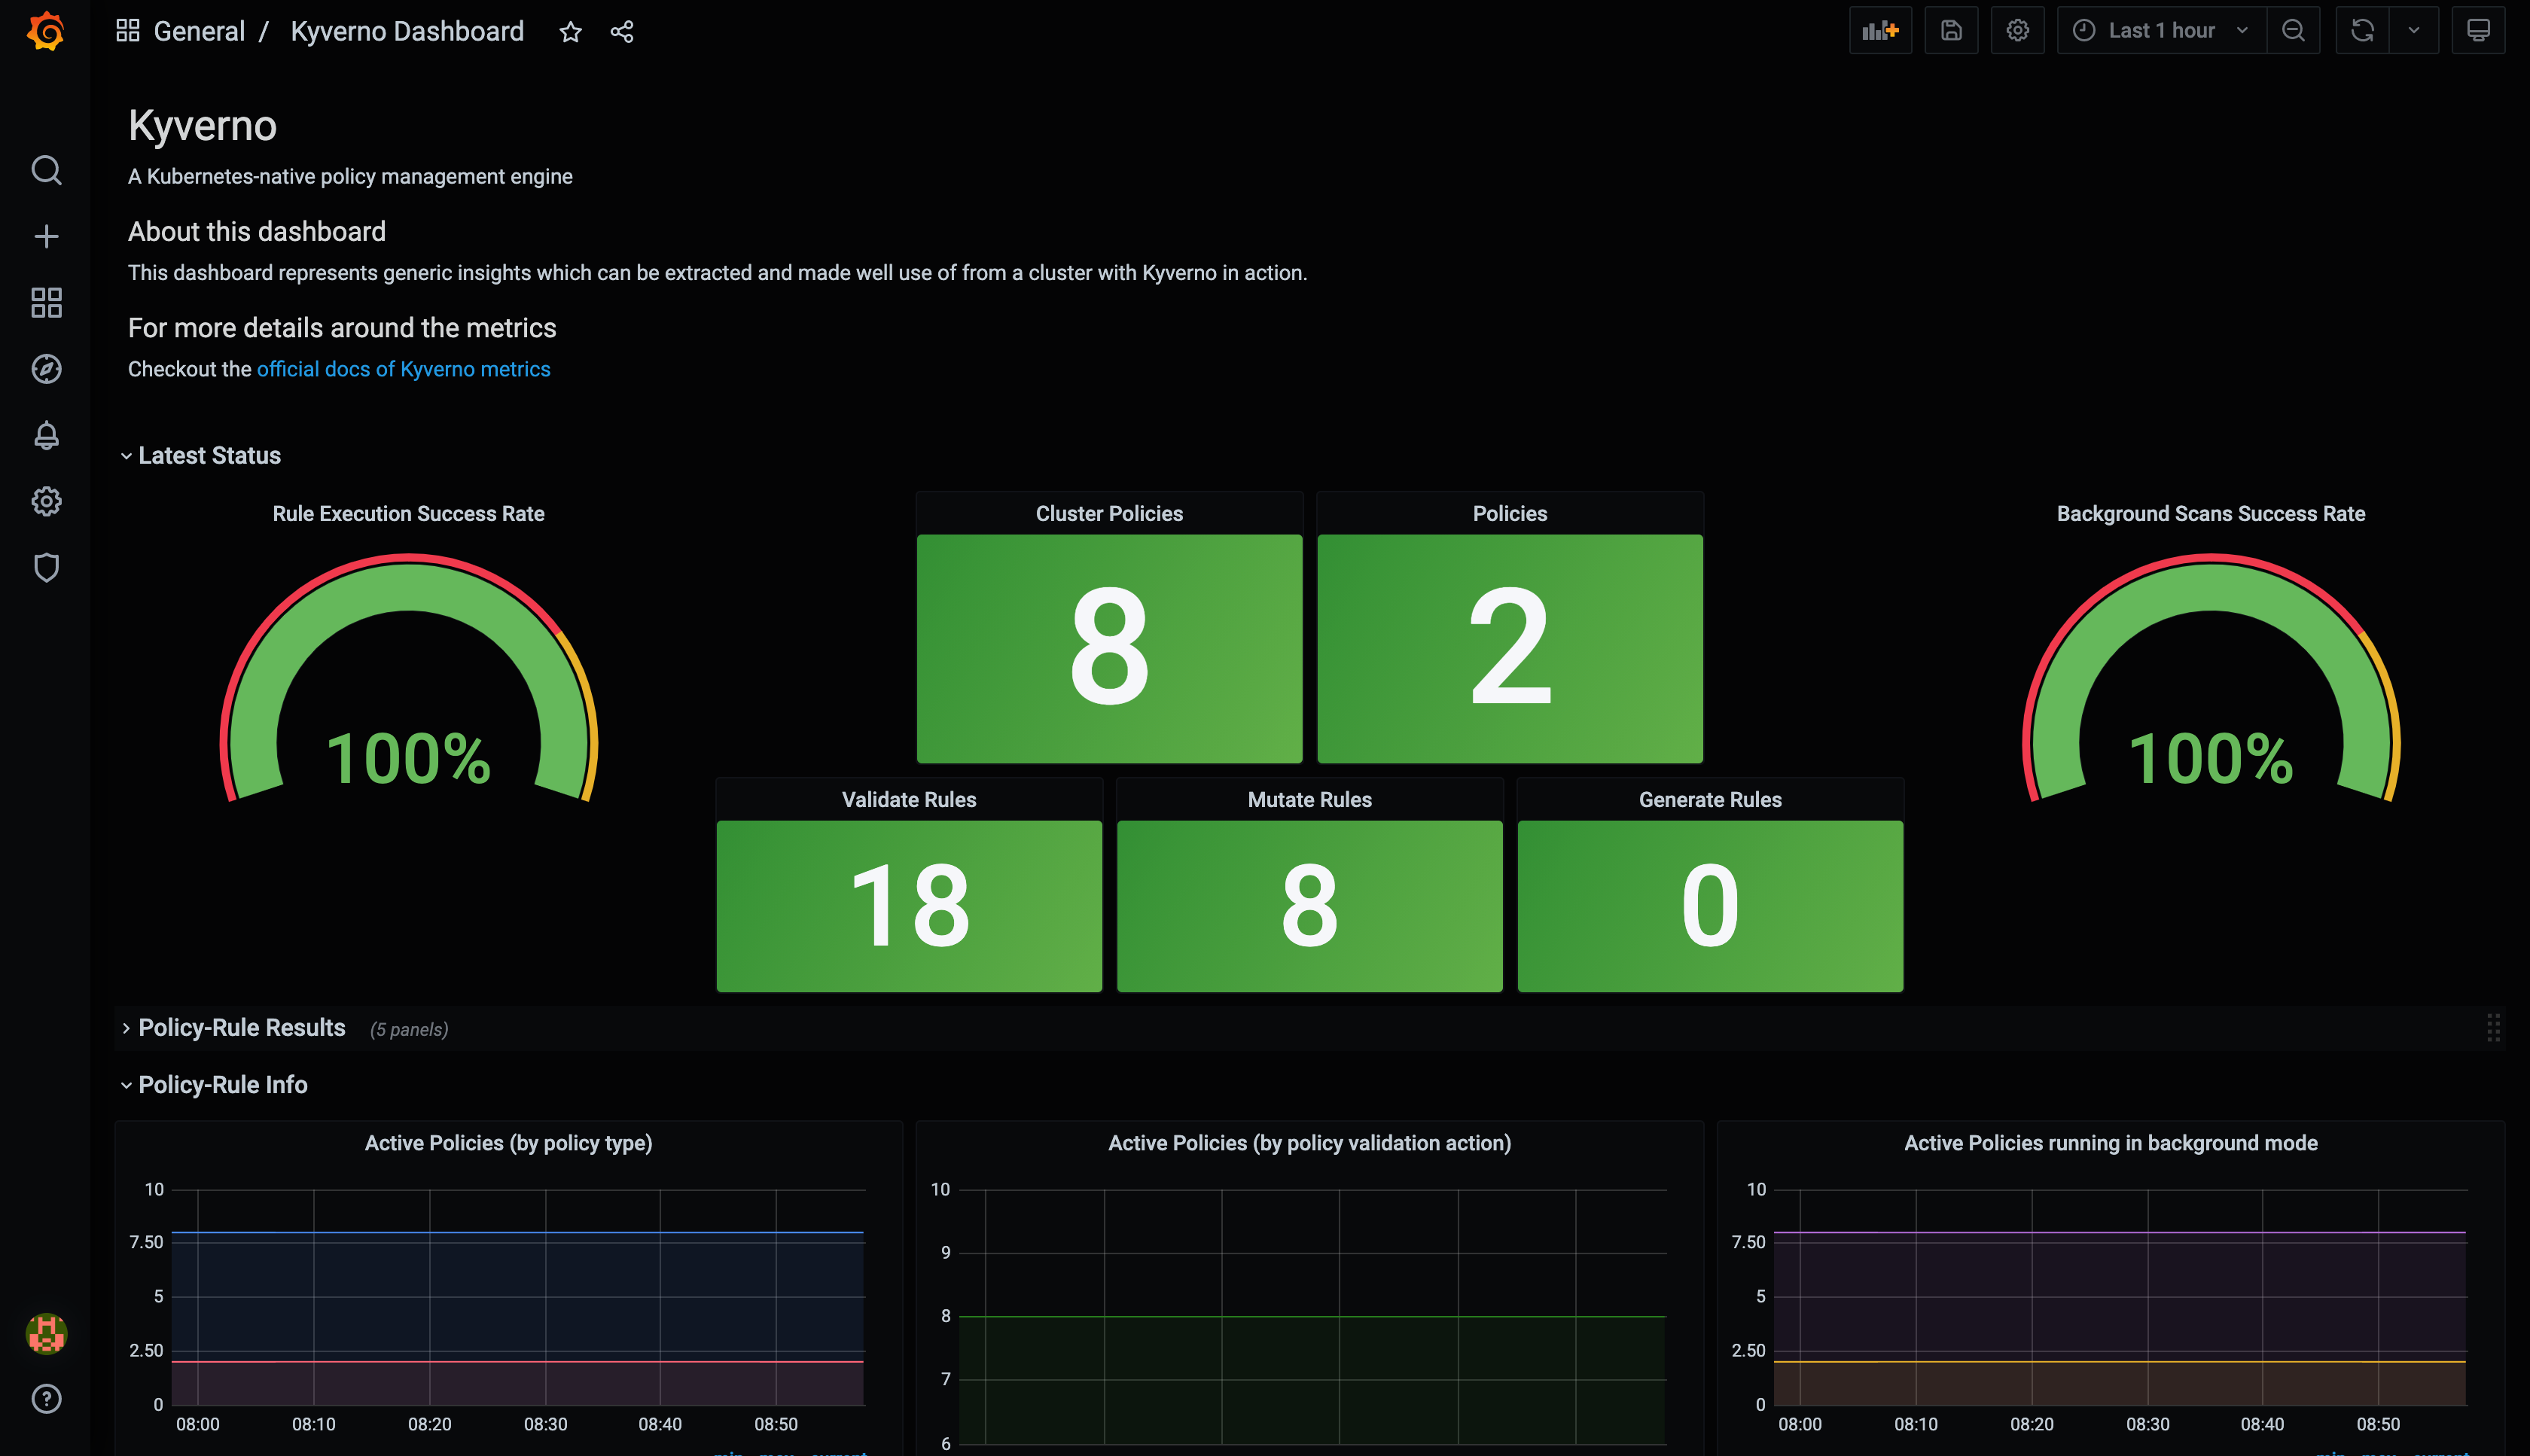
- And your dashboard will be ready in front of you.
Tutorial
1kind create cluster
Add Helm repositories.
1helm repo add prometheus-community https://prometheus-community.github.io/helm-charts
2helm repo add kyverno https://kyverno.github.io/kyverno/
Update Helm repositories.
1helm repo update
Install Kyverno and the kube-prometheus-stack Helm chart.
1helm install kyverno kyverno/kyverno --namespace kyverno --create-namespace
2helm install monitoring prometheus-community/kube-prometheus-stack -n monitoring --create-namespace
3
4kubectl -n monitoring get po -l "release"
Create the ServiceMonitor resource.
Add the following contents to a file named service-monitor.yaml.
 1apiVersion: monitoring.coreos.com/v1
 2kind: ServiceMonitor
 3metadata:
 4  labels:
 5    app.kubernetes.io/instance: monitoring
 6    chart: kube-prometheus-stack-51.2.0
 7    heritage: Helm
 8    release: monitoring
 9  name: service-monitor-kyverno-service
10  namespace: monitoring
11spec:
12  endpoints:
13  - interval: 60s
14    path: /metrics
15    scheme: http
16    targetPort: 8000
17    tlsConfig:
18      insecureSkipVerify: true
19  namespaceSelector:
20    matchNames:
21    - kyverno
22  selector:
23    matchLabels:
24      app.kubernetes.io/instance: kyverno
Add the appropriate labels.
1kubectl label ns kyverno app.kubernetes.io/instance=kyverno
2kubectl label ns kyverno app.kubernetes.io/name=kyverno
Create the ServiceMonitor.
1kubectl apply -f service-monitor.yaml
Restart Deployments and StatefulSets in the monitoring Namespace.
1kubectl rollout restart deploy,sts -n monitoring
Check services in the monitoring Namespace.
1kubectl get svc -n monitoring
2
3NAME                                      TYPE        CLUSTER-IP      EXTERNAL-IP   PORT(S)                      AGE
4monitoring-kube-prometheus-prometheus     ClusterIP   10.96.238.189   <none>        9090/TCP,8080/TCP            4h16m
Port forward the monitoring-kube-prometheus-prometheus Service to a local port.
1kubectl port-forward svc/monitoring-kube-prometheus-prometheus 81:9090 -n monitoring
2
3Forwarding from 127.0.0.1:81 -> 9090
4Forwarding from [::1]:81 -> 9090
Similarly, port forward the monitoring-grafana Service to another local port.
1kubectl get svc -n monitoring
2
3NAME                                      TYPE        CLUSTER-IP      EXTERNAL-IP   PORT(S)                      AGE
4monitoring-grafana                        ClusterIP   10.96.188.20    <none>        80/TCP                       4h19m
5
6kubectl port-forward svc/monitoring-grafana -n monitoring 82:3000
7
8Forwarding from 127.0.0.1:82 -> 3000
9Forwarding from [::1]:82 -> 3000
Go to Prometheus on port 9090 and check status -> Targets -> Filter for kyverno (to see if metrics are getting scraped)
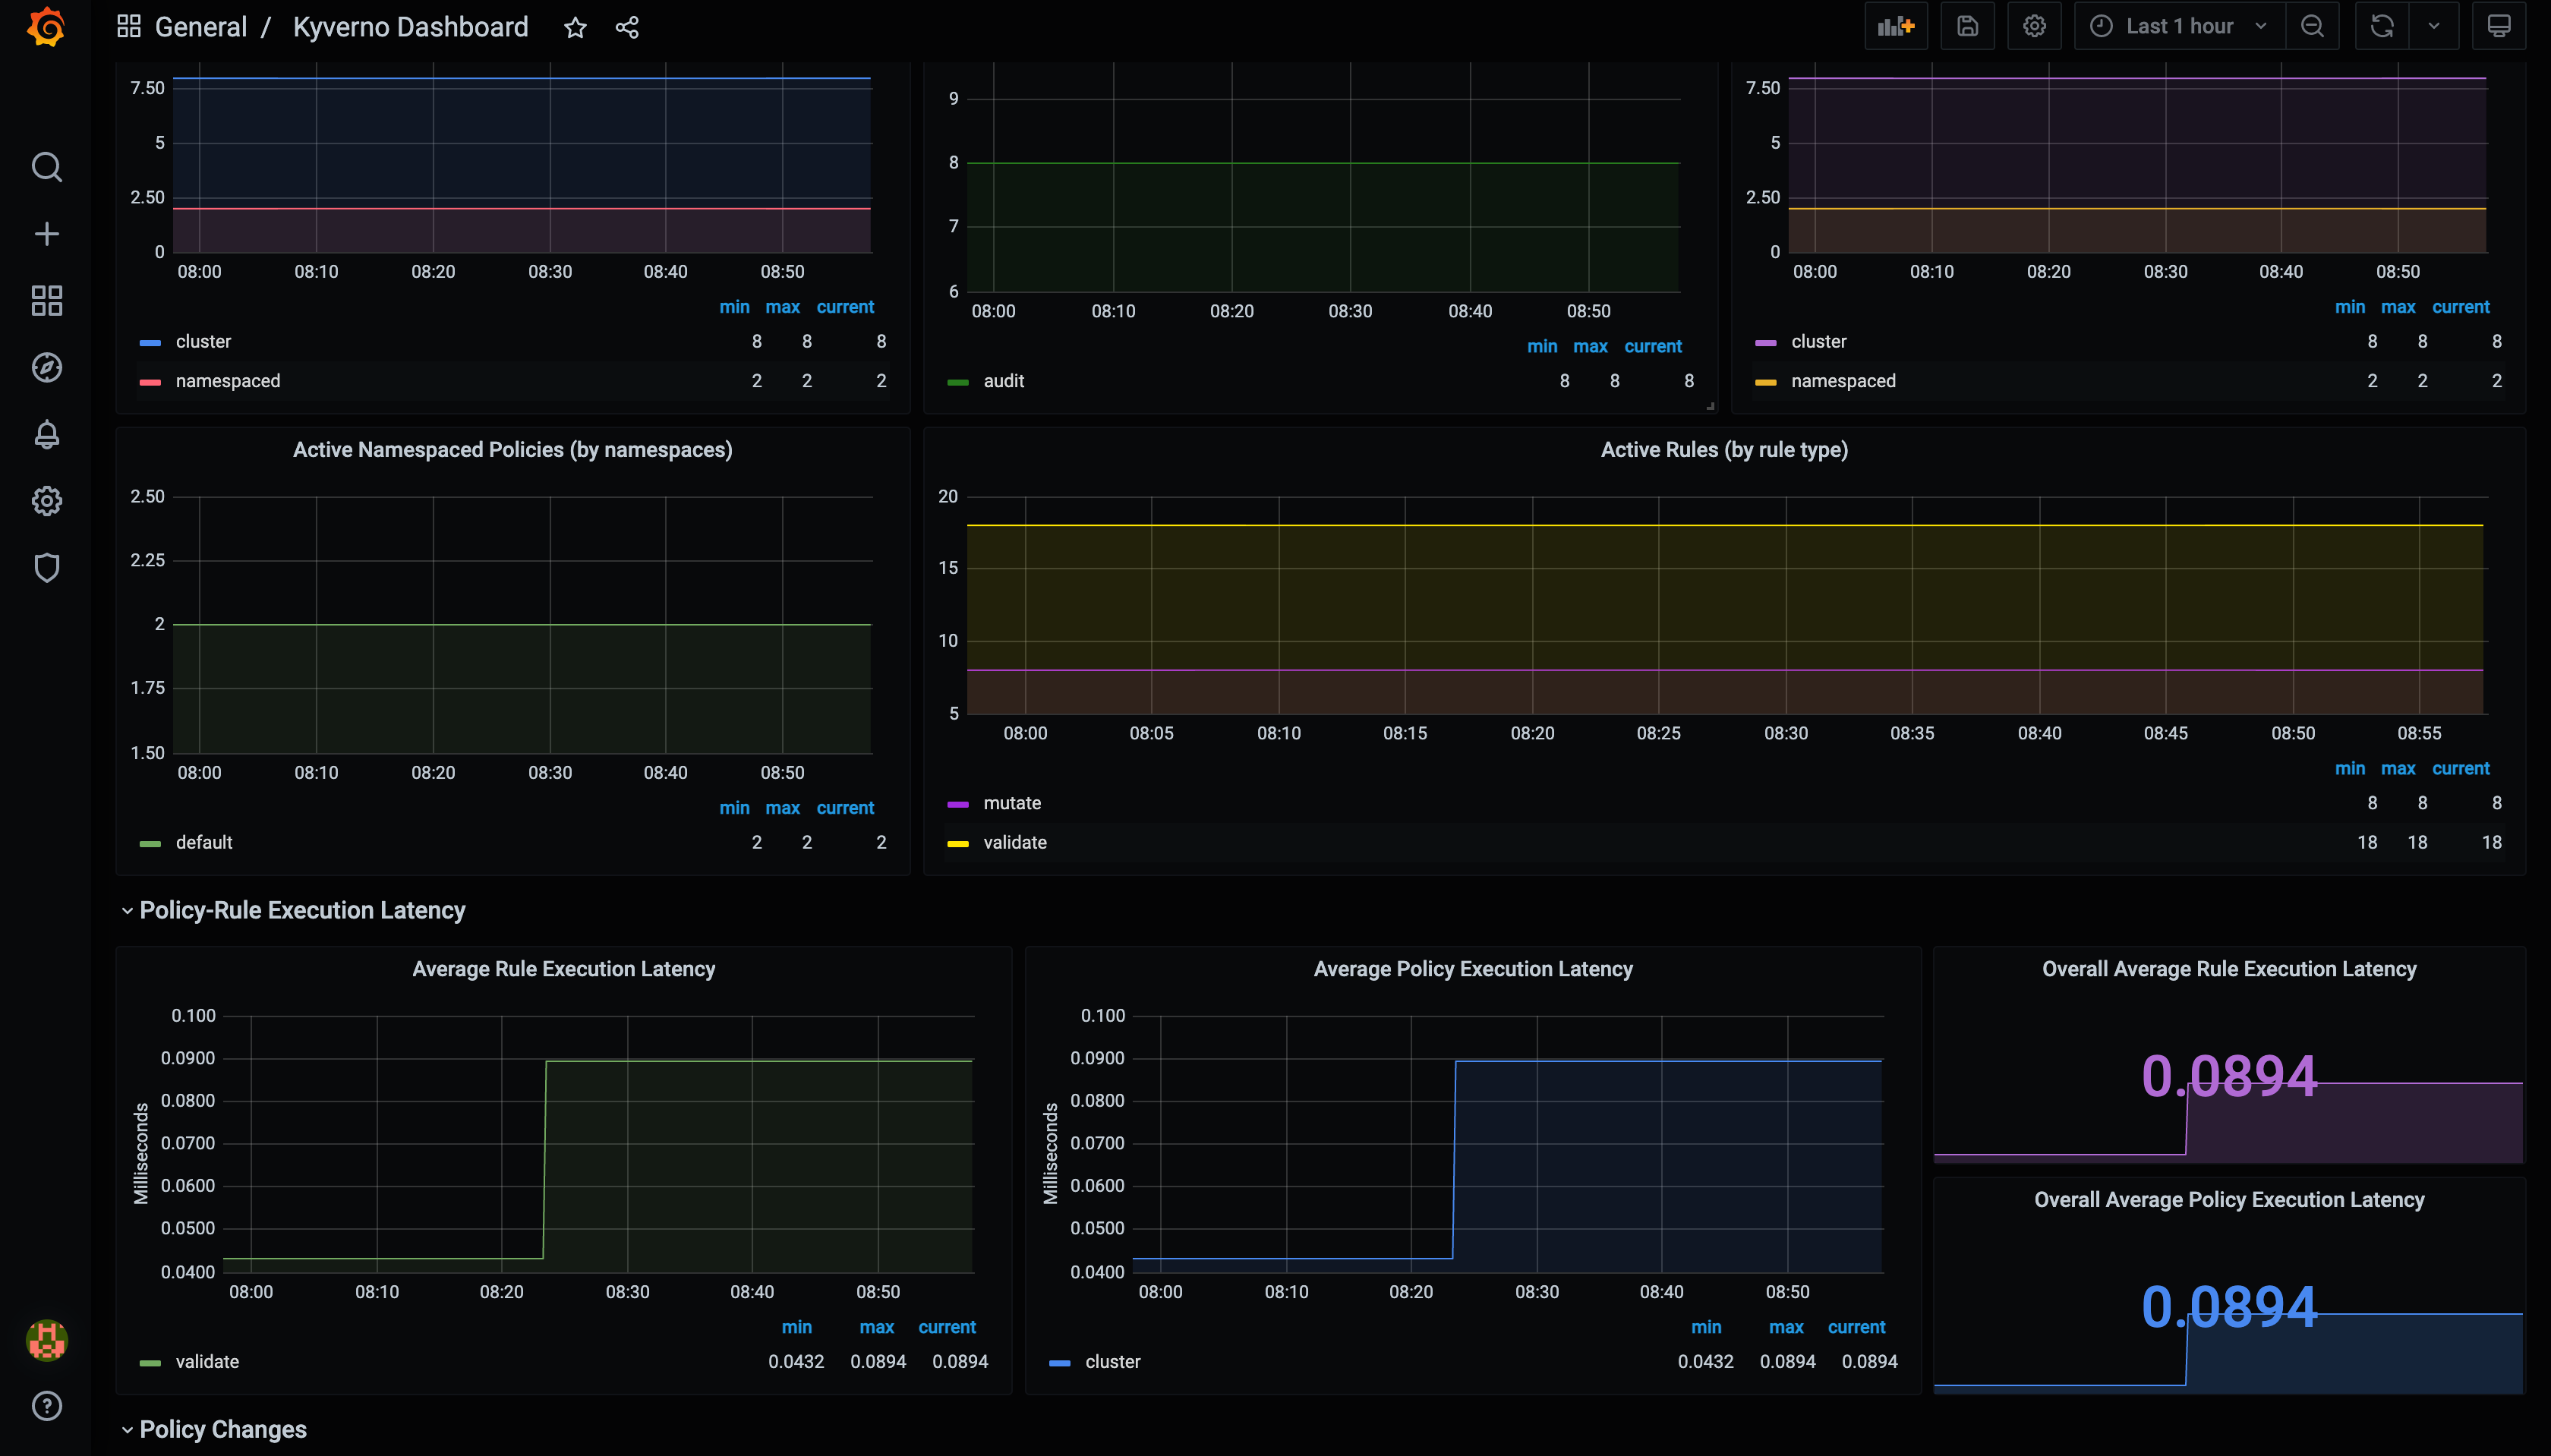
Go to Grafana on port 3000 -> Dashboards -> New -> import -> Upload file that you get from running the below command -> Data type = Prometheus -> import
1curl https://raw.githubusercontent.com/kyverno/grafana-dashboard/master/grafana/dashboard.json -o kyverno-dashboard.json
Feedback
Was this page helpful?
Glad to hear it! Please tell us how we can improve.
Sorry to hear that. Please tell us how we can improve.